COVID-19 Canada Data Explorer. Click picture to open.
Update: the COVID-19 Canada Data Explorer was endorsed by the Macdonald-Laurier Institute – one of Canada’s leading public policy think tanks!
Update 2: My public policy brief Designing COVID-19 Data Tools, co-authored with Ken Coates and Carin Holroyd, was published by the Johnson Shoyama Graduate School of Public Policy, University of Saskatchewan. The brief uses COVID-19 Canada Data Explorer as an example, and makes a comparative overview of COVID-19 data analysis and visualization tools available from Canada’s federal and provincial governments.
Update 3:
This is a more or less final version, so here is the source code for the app. And here is the code used to retrieve and pre-process geospatial data.
***
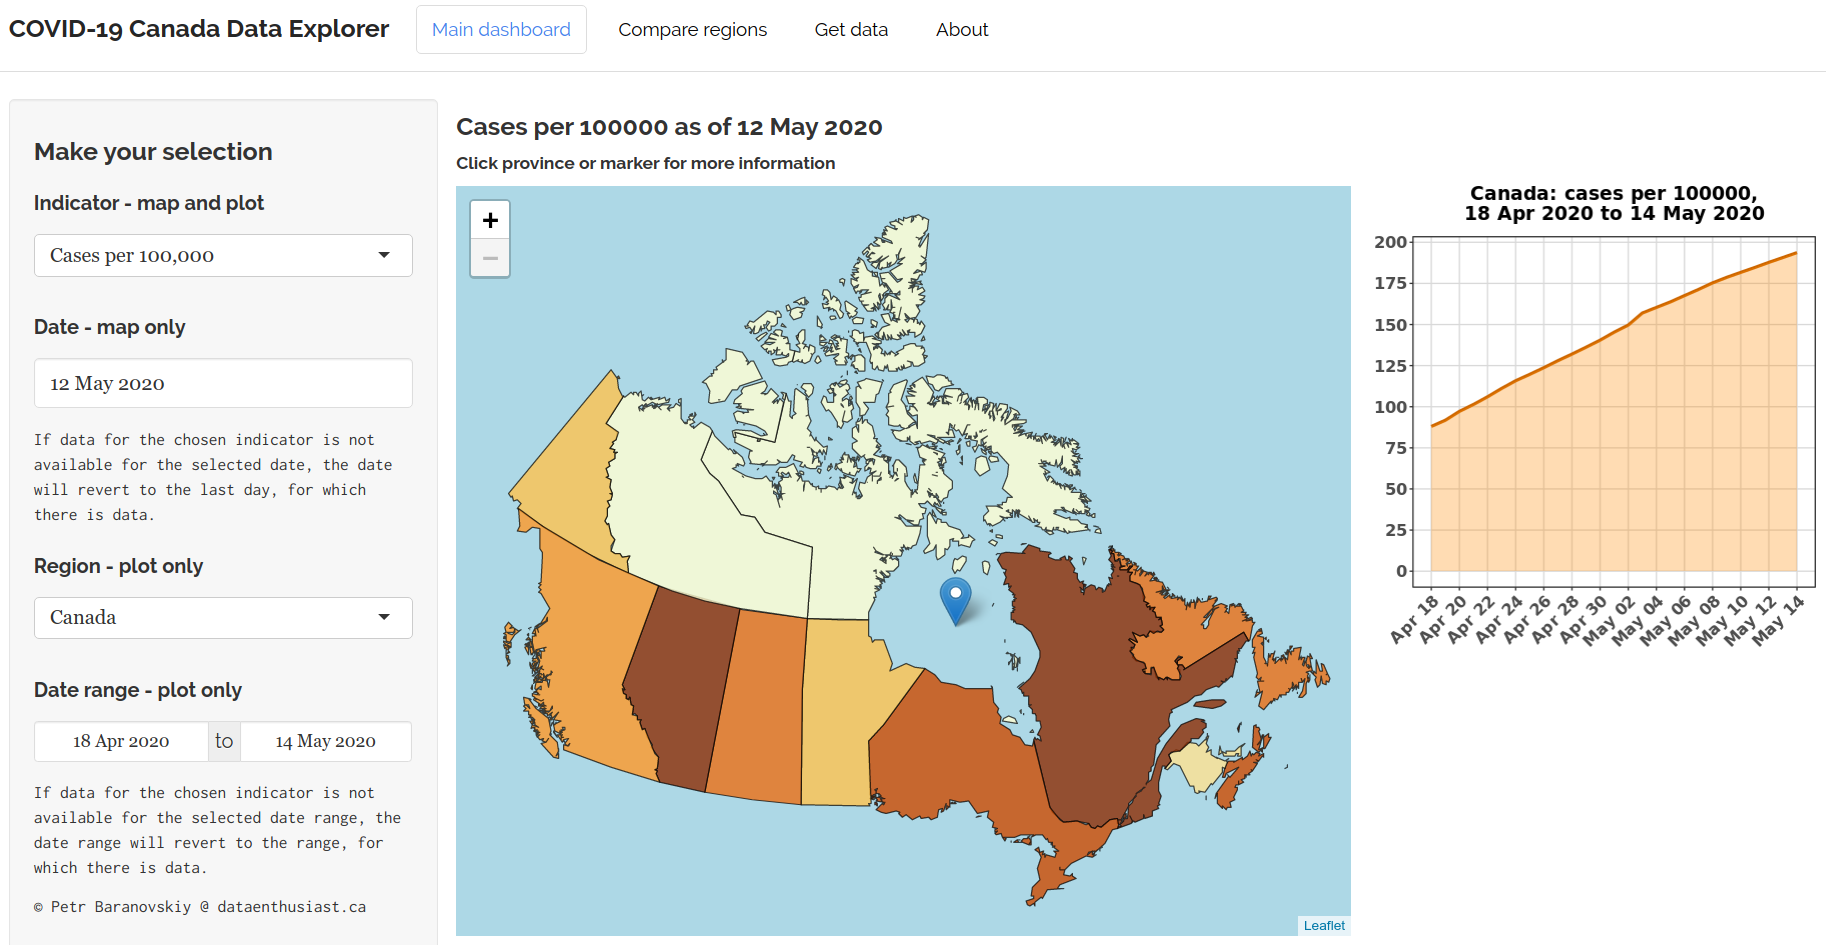
In the times of the pandemic, the data community can help in many ways, including by developing instruments to track and break down the data on the spread of the dreaded coronavirus disease. The COVID-19 Canada Data Explorer app was built with R, including Shiny, Leaflet, and plotly, to process the official dataset available from the Government of Canada. They do have their own data visualization tool, but it is very basic. You can do so much more with the available data!
The data is downloaded from Canada.ca at 6-hour intervals to minimize the load on the repository – there is likely a high demand due to the pandemic. This means that there may be a delay of up to six hours from the time Canada.ca update their data to the moment it is updated on my server.
I hope that my app will help public health professionals, policymakers, and really anyone to stay informed about the course of SARS-CoV-2 epidemic in Canada.